In a hyper-connected world, shocks rarely stay contained. A local disruption can quickly become systemic. Geoeconomic fragmentation, trade and energy shocks, regulatory shifts, cyber threats, and labour constraints now interact. This raises the odds that a strain in one area creates pressure across many others. Recent tensions around the Strait of Hormuz have shown how regional conflict can disrupt global trade, raise costs, and unsettle markets worldwide.
Asian economies are especially exposed. External shocks ripple through trade and supply chain links. Domestic volatility presents legal, labour-market, and infrastructure risks. Using correlation analysis of EIU data, the report The Risk Butterfly Effect, developed by The Economist and supported by Marsh Asia maps the strongest risk linkages in four markets: China, Hong Kong SAR, Japan, and Singapore. Each market shows a distinct pattern, and those patterns continue to shift. Understanding these linkages, their drivers, and possible triggers can help business leaders decide which risks matter most, where to allocate resources, and how to build resilience against multiple challenges at once.
Which risk linkages matter most for Asian business leaders?
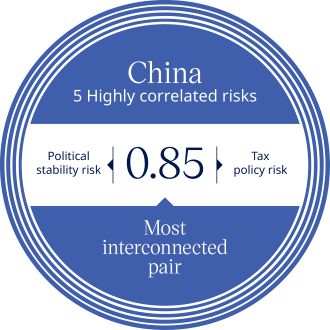
China
|
China’s risk profile is shaped by policy volatility, and trade and fiscal pressure. Several high-risk hubs — especially foreign trade, political stability, and macroeconomic risk — anchor a dense web of correlations, with political stability and tax policy risk forming the most interconnected pair. |
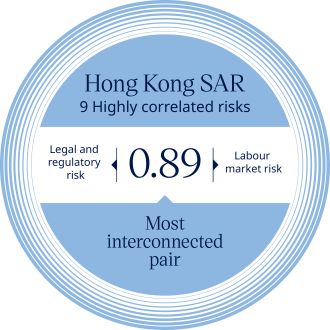
Hong Kong SAR
|
Hong Kong SAR’s risk landscape is shaped by legal shifts, labour strain, and cybersecurity: The strongest connection is between legal and regulatory risk and labour-market risk, while a second cluster links political stability with security and financial risks. |
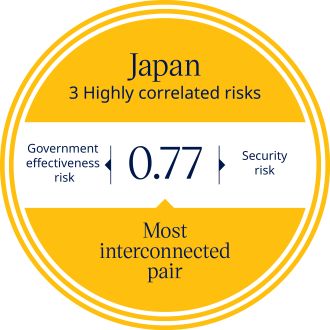
Japan
|
Japan’s main vulnerabilities link governance, security, and infrastructure. The dominant risk cluster connects cybersecurity risk with infrastructure exposure to natural disasters, testing the state’s capacity and resilience. |
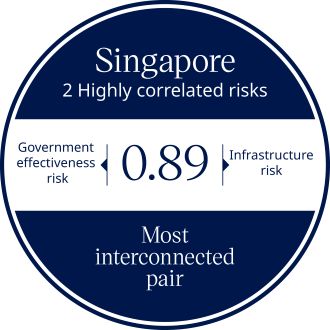
Singapore
|
Singapore shows the least systemic fragility. Its chief vulnerability, labour-market risk, remains largely self-contained, which limits the scope for spillovers. At the same time, the risks that are most tightly correlated carry low underlying scores. |
*Highly correlated risks = correlation value of 0.6 or more *Number of rings represent the number of highly correlated risks


